Backtests rarely fail.
Live trading often does.
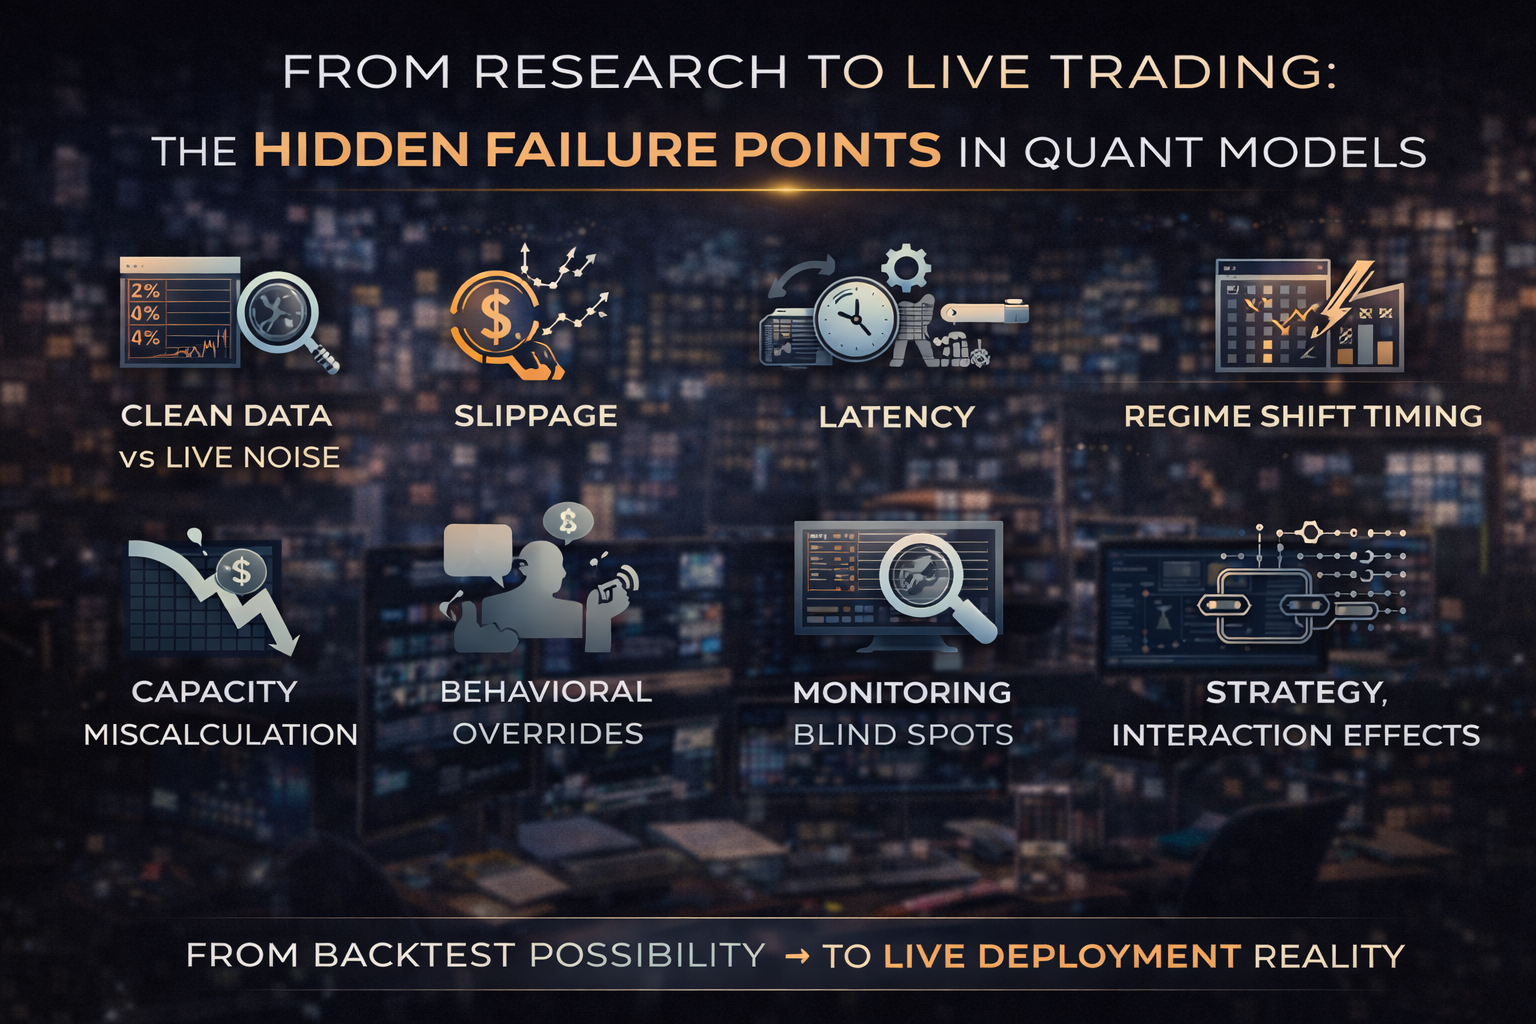
The transition from research environment to production capital deployment is where many quantitative strategies quietly collapse.
At Linitics, we consider deployment risk as critical as signal quality. A model that survives validation but fails in production is not robust — it is incomplete.
Understanding the hidden failure points between research and live execution is essential to building durable systematic strategies.
1. The Illusion of Clean Data
Research datasets are typically:
- Cleaned
- Adjusted
- Survivorship-bias corrected
- Timestamp aligned
Live markets are not.
Hidden issues include:
- Delayed feeds
- Inconsistent corporate action adjustments
- Missing ticks
- Real-time revision noise
- Exchange-specific anomalies
A model built on perfect historical data may not behave the same way in live, imperfect conditions.
Data integrity must be monitored continuously — not assumed.
2. Slippage & Execution Drift
Backtests often assume:
- Fixed bid–ask spreads
- Constant liquidity
- Immediate fills
Live markets introduce:
- Spread widening in volatility spikes
- Partial fills
- Queue priority loss
- Market impact from scaling
Microstructure research consistently shows that transaction costs can materially degrade theoretical alpha — particularly in high-turnover strategies.
The sharper the turnover profile, the larger the reality gap.
Execution modeling must be conservative, not optimistic.
3. Latency & Infrastructure Friction
In research:
Orders execute instantly.
In production:
- Orders travel
- Servers process
- Exchanges queue
- Confirmation returns
Even millisecond delays can alter fill quality in fast-moving environments.
While ultra-low latency is not necessary for all strategies, infrastructure reliability is.
Common operational risks include:
- Connectivity outages
- API disconnections
- Data feed interruptions
- Order routing errors
Automation reduces manual effort — not operational exposure.
4. Regime Shift Timing
A model validated on historical regimes may go live during:
- Volatility expansion
- Rate tightening cycles
- Structural macro shifts
- Liquidity contraction
The deployment timing risk is underappreciated.
Even robust strategies can underperform immediately post-launch due to unfavorable regime alignment.
Without disciplined capital scaling, this initial underperformance can trigger premature abandonment.
5. Capacity & Scaling Miscalculation
A strategy tested at small notional exposure may face:
- Nonlinear impact scaling
- Liquidity constraints
- Correlated execution pressure
Capacity assumptions must be stress-tested before scaling.
Many models that appear profitable at $1M fail structurally at $20M.
The research environment rarely simulates capital pressure accurately.
6. Behavioral Overrides
One of the most common failure points is not technical — it is human.
Common breakdowns include:
- Disabling a model mid-drawdown
- Increasing leverage to “recover”
- Ignoring predefined risk thresholds
- Tweaking parameters reactively
Institutional firms mitigate this with:
- Predefined governance
- Risk committees
- Structured evaluation periods
Personal operators often lack this discipline.
A robust model can still fail under inconsistent execution behavior.
7. Monitoring Blind Spots
Research validation focuses on:
- Return metrics
- Sharpe ratios
- Drawdowns
Production monitoring must include:
- Rolling performance drift
- Execution cost changes
- Exposure anomalies
- Correlation shifts
- Volatility mismatches
Without real-time monitoring dashboards, early warning signs are missed.
Decay rarely happens instantly. It begins subtly.
8. Overconfidence from Short Live Samples
A common error:
Declaring success after three profitable months.
Short-term positive performance does not validate robustness.
Conversely, short-term underperformance does not invalidate structural logic.
Live performance must be evaluated against:
- Expected distribution
- Historical variance bands
- Drawdown projections
Without statistical context, decision-making becomes emotional.
9. Strategy Interaction Effects
In isolation, strategies may behave well.
In combination, they may:
- Increase correlation under stress
- Amplify drawdowns
- Compete for liquidity
- Increase turnover unintentionally
Portfolio-level behavior can differ materially from single-strategy simulations.
Institutional deployment requires cross-strategy correlation control.
10. The Deployment Discipline Framework
A professional research-to-production pipeline includes:
- Reduced capital initial rollout
- Strict performance monitoring window
- Execution cost audit
- Correlation stress testing
- Predefined decommission thresholds
Deployment is a probationary phase.
Not a victory lap.
11. Why Most Failures Are Structural, Not Statistical
When quant strategies fail live, the cause is rarely:
- Mathematical incompetence
It is more often:
- Infrastructure gaps
- Capital mismanagement
- Behavioral inconsistency
- Cost underestimation
- Regime misalignment
The transition from theory to capital is an engineering problem.
Not a coding problem.
Final Thoughts
Research proves possibility.
Live trading proves durability.
The hidden failure points between the two define whether a model becomes:
- A sustainable capital engine
or - A backtest artifact
At Linitics, deployment is treated as a controlled engineering process — governed by liquidity discipline, risk containment, and continuous monitoring.
Because the real test of a quant model is not its Sharpe ratio.
It is its survival under live capital pressure.