Return expectations shape behavior.
Unrealistic expectations destroy capital.
In U.S. markets — the deepest and most liquid capital markets globally — both investing and trading offer opportunity. But their statistical realities differ materially.
At Linitics, we emphasize return expectations grounded in empirical evidence, volatility structure, and structural risk — including often-overlooked legal risks such as U.S. estate taxation.
1. Long-Term Investing: The Empirical Baseline
Historically:
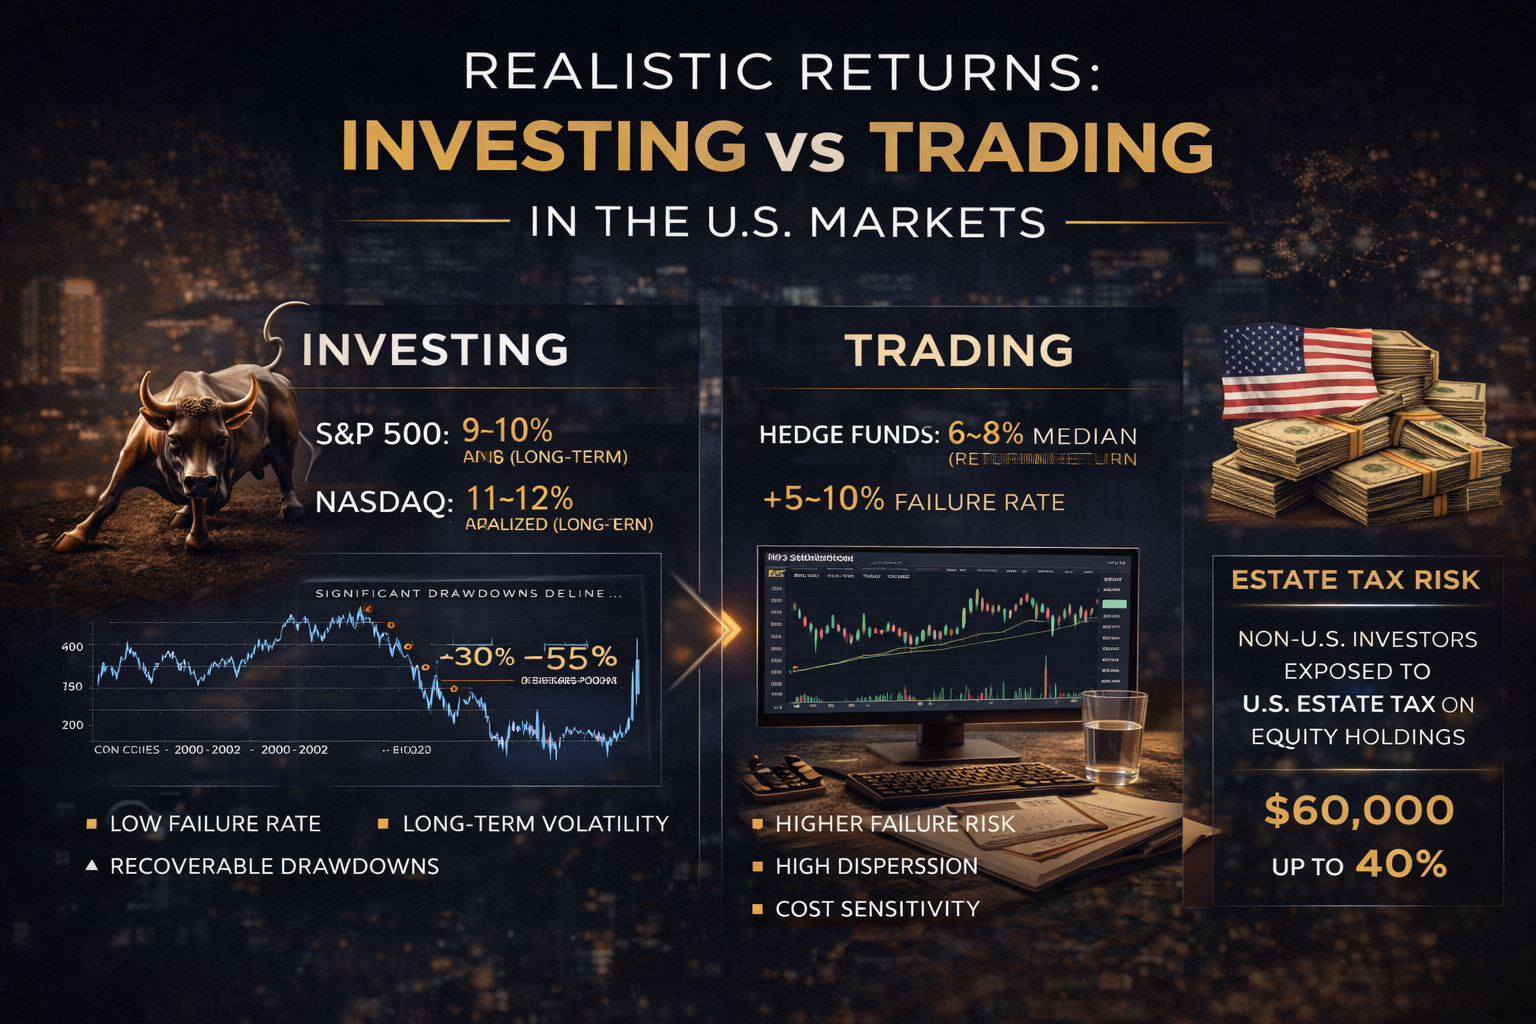
- The S&P 500 has delivered approximately 9–10% annualized returns over long horizons.
- The Nasdaq Composite has produced higher long-term averages (~11–12%), but with significantly higher volatility.
- Average maximum drawdowns in equity markets have ranged between 30%–55% during major crises (2000–2002, 2008, 2020).
Important observations:
- Returns are not linear.
- Long-term averages mask multi-year stagnation periods.
- Compounding works only if capital survives drawdowns.
Investing is statistically attractive — but psychologically demanding.
2. Volatility & Drawdown Reality
Consider:
- The S&P 500 experienced a ~57% drawdown during the 2008 financial crisis.
- During the 2000–2002 dot-com collapse, the Nasdaq fell nearly 78% peak-to-trough.
- Even in the modern era (2022), U.S. equities saw significant double-digit corrections driven by rate regime shifts.
Long-term averages ignore path dependency.
The path matters.
3. Trading Returns: Distribution Is Wide
Unlike passive investing, trading returns have:
- Higher dispersion
- Higher turnover
- Greater sensitivity to costs
- Higher failure rates
Industry data suggests:
- Hedge fund median annual returns historically cluster around 6–8%, net of fees.
- Top-quartile managers significantly outperform.
- Many funds underperform indices after fees.
- Annual hedge fund attrition rates typically range between 5–10%.
Trading can outperform.
But the distribution is wide and survival-dependent.
4. Transaction Costs & Alpha Decay
Active trading faces structural headwinds:
- Slippage
- Bid–ask spread costs
- Market impact
- Strategy crowding
Academic microstructure studies show transaction costs can erode a large portion of gross alpha in high-frequency systems.
Retail traders often underestimate cost drag.
Net performance matters — not gross signal strength.
5. Survivorship Bias in Performance Narratives
Performance discussions frequently highlight:
- The top-performing traders
- Outlier hedge funds
- Exceptional compounding stories
They rarely highlight:
- Strategy decay
- Closed funds
- Underperforming systematic programs
The median outcome differs from the marketed outcome.
Institutional capital allocators understand this.
Individuals often do not.
6. Risk-Adjusted Returns Matter More Than Absolute Returns
A 20% annual return with 40% volatility is structurally different from:
A 12% annual return with 12% volatility.
Metrics to consider:
- Sharpe ratio
- Sortino ratio
- Maximum drawdown
- Calmar ratio
- Exposure-adjusted return
Trading that produces high returns but collapses under stress is not superior — it is fragile.
7. The Overlooked Risk: U.S. Estate Tax Exposure
For non-U.S. investors, U.S. estate tax introduces a material structural risk.
Under current U.S. law:
- Non-resident aliens may face U.S. estate tax on U.S.-situs assets (including U.S. equities).
- The exemption threshold for non-residents is typically only $60,000, significantly lower than the multi-million-dollar exemption for U.S. citizens.
- Estate tax rates can reach up to 40% on taxable amounts above the exemption.
This creates an overlooked risk for:
- Direct U.S. stock holdings
- U.S.-domiciled ETFs
- Certain brokerage accounts
For international investors, structure matters:
- Use of non-U.S.-domiciled funds
- Jurisdictional planning
- Estate planning vehicles
Return analysis without legal structure analysis is incomplete.
8. Capacity & Liquidity Considerations
Investing in broad U.S. indices scales efficiently.
Trading strategies, however, encounter:
- Capacity limits
- Liquidity stress
- Impact scaling
As capital increases, marginal returns compress.
Realistic expectations must incorporate scalability assumptions.
9. What Is Realistic?
Based on long-term empirical data:
Passive investing in U.S. equities:
- 7–10% long-term average
- Multi-year volatility
- Deep but recoverable drawdowns
Active systematic trading:
- Wide dispersion
- Median outcomes often below marketed narratives
- Survivorship-dependent long-term success
- Requires operational discipline
Expectations beyond these baselines demand:
- Superior infrastructure
- Risk engineering
- Liquidity access
- Capital discipline
Final Thoughts
U.S. markets offer opportunity.
But realistic return expectations require acknowledging:
- Volatility
- Drawdowns
- Cost drag
- Strategy decay
- Survivorship bias
- Estate tax exposure for international investors
Return is only one dimension.
Structure, jurisdiction, and survival matter equally.
At Linitics, we approach capital deployment through:
- Risk-adjusted realism
- Liquidity discipline
- Structural awareness
- Institutional governance
Because realistic expectations are the foundation of durable performance.